transition to chaos
|
Effect of noise on the Feigenbaum transition to chaos |
Feigenbaum's scenario of transition to chaos via period-doubling bifurcation cascade occurs in many systems, for example, in Rossler and Lorenz models, in iterative maps of Henon and Ikeda, in a circle map inside the Arnold tongues, in an oscillatory RL-diode circuit and other driven dissipative nonlinear oscillators, in self-oscillatory systems like Anischenko - Astakhov generator, Dmitriev - Kislov generator, Chua circuit. It was reported in literature about experimental observation of the Feigenbaum transition in convection in liquid helium and mercury, in acoustic oscillations of bubbles in liquid, in Q-switched lasers, in hybrid acousto-optic delay systems, in phase-locked loops, in backward-wave oscillators. This list may be continued.
In real physical systems presence of noise is inevitable. As a rule, it may be regarded as a small random external driving on the system. As we know, without noise the universal Feigenbaum scaling regularities take place in generic period doubling transition to chaos. Then, we should expect that a kind of quantitative universality and scaling must accompany also the behavior at the transition in presence of noise as well. To uncover it we turn naturally to the simplest representative of the Feigenbaum universality class, the quadratic (logistic) map with added random term:
![]()
Here xn is a sequence of statistically independent random variables with zero mean value and fixed variance s. The constant k characterizes intensity of noise.
Renormalization group (RG) analysis suggested by Crutchfield et al. [1981] and Shraiman et al. [1981] concludes that a universal constant exists indicating, by which factor have we to reduce the noise to observe each next level of the period doubling: g=6.619036513. (Content of the RG analysis see here.) More circumstantial formulation of the scaling property is the following.
Let us assume that
at some parameter value l close to
the Feigenbaum critical point and at sufficiently
small noise level
k a certain regime of behavior is observed. Then,
at the parameter l deflection from the critical point less by
factor
Let us consider some computer illustrations of the mentioned scaling.
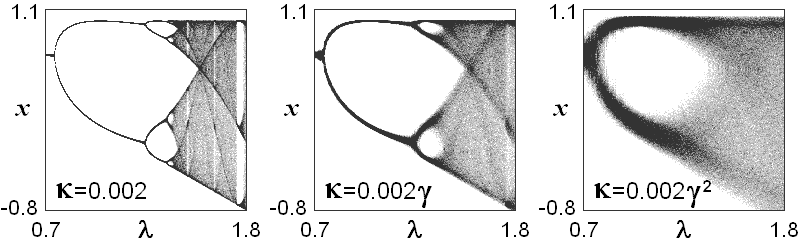
The first figure shows "bifurcation trees" for a noisy quadratic map. A horizontal axis corresponds to the control parameter l, and the vertical axis to the dynamical variable values x in the course of a large number of iteration (with exclusion of the initial part of the series corresponding to the transient process). Due to presence of the noise, the "branches" of the bifurcation tree are smeared out, so the high-leve bifurcations become indistinguishable. Each next picture corresponds to intensity of noise increased by factor g in comparison with the previous one, and, respectively, the number of distinguishable bifurcations becomes less by one.
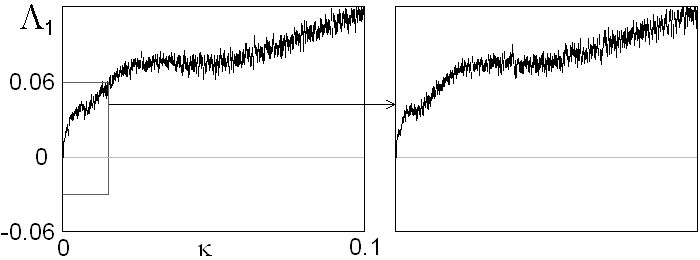
The following picture illustrates a dependence of the Lyapunov exponent for the quadratic map on the intensity of noise at fixed l, corresponding to the Feigenbaum critical point. With decrease of the noise amplitude by the factor g the dynamics has to be similar to the original in statistical sense, but with a twice larger characteristic time. It corresponds to a twice less value of the Lyapunov exponent. Hence, the plot manifests the property of scaling invariance: with magnification by factor g in horizontal direction, and by factor 2 in vertical direction the observed dependence is reproduced well.
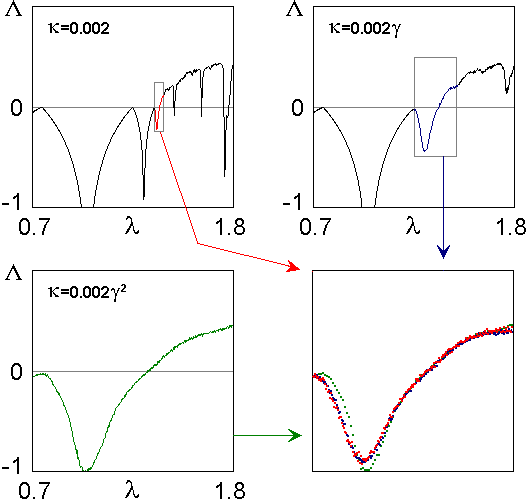
Let us consider now a diagram of dependence of the Lyapunov exponent on the parameter l. Selecting a small fragment of the picture near the Feigenbaum critical point (the left top picture) we represent it with magnification in the right bottom plot (red dots). With increase of the noise amplitude by factor g and a change of the size of the fragment selecting by d=4,6692... in horizontal direction and twice in vertical direction we observe that the dots obtained fit the same curve well.
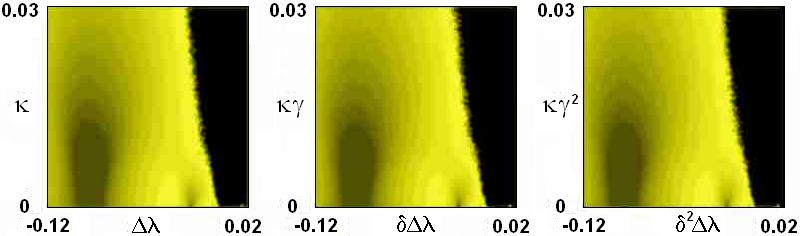
The last picture illustrates the scaling property on a Lyapunov chart on a parameter plane. The horizontal axis corresponds to parameter l, and the vertical axis to the noise intensity parameter e. For each pixel at certain l and e we compute the Lyapunov exponent and code the pixel with a color - from dark to light for values from minus infinity to zero, and black for positive values. For each successive diagram of this series we perform coordinate rescaling with factor d along the horizontal axis and factor g along the vertical one. Simultaneously we redefine the color coding to account the decrease of the characteristic time scale by the factor 2. Observe that the pictures correspond each other rather well that supports the expected scaling property.
Remark. In the course of the computations for the values xn we assumed a uniform distribution in the interval from -0.5 to 0.5, with s=1/12. This concrete selection of the distribution is not principal because for other distributions the results should be equivalent due to the expected universality. A non-pleasant feature of the Gauss distribution from the point of view of computer simulation consists in presence of "tails", formally of infinite length. It means a possibility of appearance (although with very small probability) of such random kicks that will cause divergence of the variable x to infinity.