Torus Doubling Terminal
criticality
|
Effect of noise on the Torus Doubling Terminal criticality |
Let us consider a period-doubling system driven by a quasiperiodic external force. An appropriate model is the logistic map with an additional term corresponding to the external driving
![]()
The ratio of the frequencies of the driving and of the
rhythm of the discrete time is taken to be equal to the golden-mean irrational.
On the parameter plane
(l, e)
there is a curve of the so-called torus-doubling bifurcation, which starts at the point
l=0.75,
e=0 and follows with increase of e
up to the final point, the critical point TDT (Torus Doubling Terminal),
placed at
The renormalization group (РГ) analysis of the dynamics at the TDT point was developed in [Kuznetsov, Pikovsky and Feudel, 1988]. The critical behavior at the TDT point and various dynamical regimes characteristic to its vicinity was observed in an electronic experiment with LR-diode circuit under quasiperiodic driving. [Bezruchko, Kuznetsov and Seleznev, 2000]. As in real physical systems presence of noise is inevitable, it is of interest to consider its effect on the dynamics at the TDT point. Let us turn to a model with added stochastic term:
![]()
Here xn is a sequence of statistically independent random variables with zero mean and fixed variance s, k is a parameter of intensity of noise, which is supposed to be small.
Below we present Lyapunov charts on the parameter plane
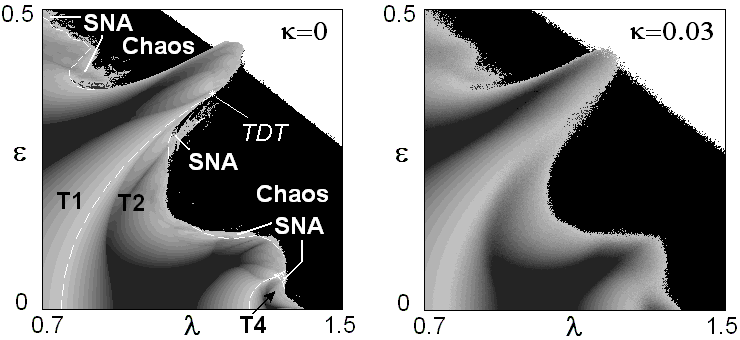
In presence of noise, the picture of main areas on the Lyapunov chart remains visible, although fine details are smeared out.
The following picture shows phase portraits of the attractors at the critical values of the parameters l and e on iteration diagrams xn+1 versus xn. The first diagram corresponds to the pure dynamics (no noise), the second and the third to the noise intensity parameter values indicated on the plots k.
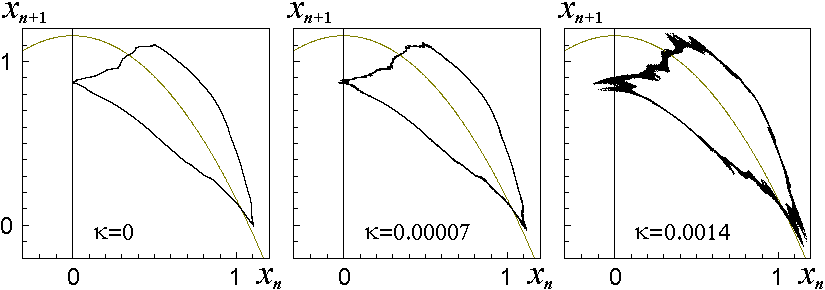
Observe how successively disappear with increase of noise first the subtle and tham more rough details of the attractor.
As certain scaling regularities take place near the TDT point, the effect of noise also must reveal some scaling properties.
Renormalization group analysis of the problem with noise leads to a conclusion that for observation of each next level of the small-scale structure associated with the point TDT (that corresponds to increase of the characteristic time scale by factor W3=4.236068...) the noise amplitude must be reduced by the factor g=20.048637712.
For more accurate formulation of the scaling regularities, it is appropriate to introduce a special local coordinate system on the parameter plane. In accordance with the numerical computations, for our model it may be defined by the following relations:
![]()
Let us assume that near the TDT in presence of the noise of intensity
k we observe some regime at the parameter values
l and e,
which correspond to local coordinates c1 and c2.
Then, at the parameter values corresponding to
c1/d1
and
c1/d2,
where
Let us consider several computer illustrations of the suggested scaling law.
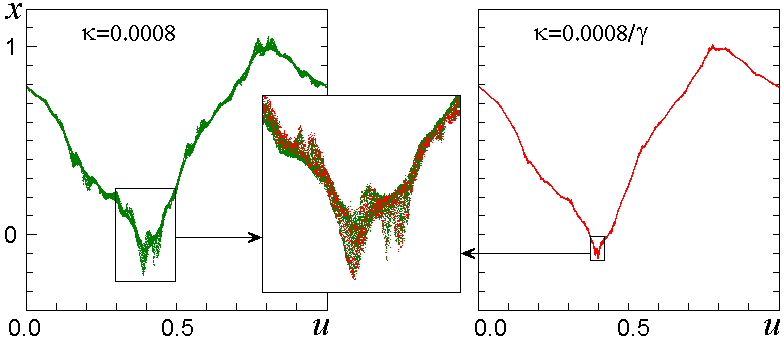
We start with the plots depicting the "noisy" attractor in coordinates u, x. In the second plot the noise intensity is reduced by the factor g in comparison with the first one. The parameter values l and e correspond to the critical point TDT. On each diagram we select a fragment reproduced in the inset in the middle; there the magnification factor for the second attractor is larger by the factor a along the axis x and by the factor W3 along the axis u. A nice correspondence of the superimposed "red" and "green" objects illustrates the scaling property for the noisy system.
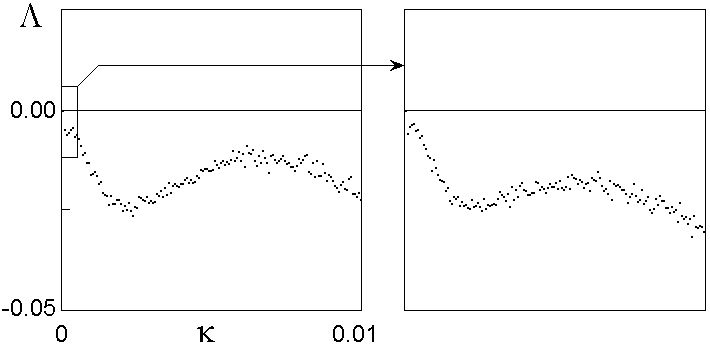
Let us turn now to the diagrams indicating dependence of the Lyapunov exponent on the noise intensity at the TDT point. As seen from the picture, presence of the noise leads to decrease of the Lyapunov exponent, i.e. has stabilizing effect (in contrast to the Feigenbaum transition when the noise gives rise to increase of the Lyapunov exponent). The inset shows a fragment of the plot with rescaling in horizontal direction by factor g, and in vertical direction by factor в W3. Similarity of both these pictures reveals the expected scaling property.
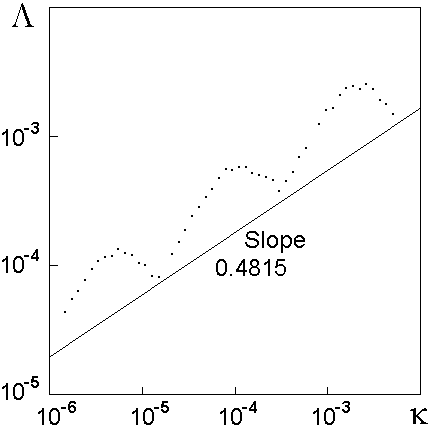
One more way to demonstrate scaling consists in representation of the Lyapunov exponent versus the noise intensity in the double logarithmic scale. As seen from the plot, the dots follow in average a straight line with the slope loggW3=0.4815.
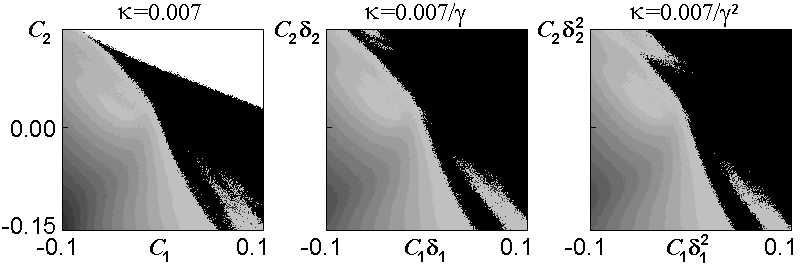
Another series of the illustrations presents the Lyapunov charts
on the parameter plane relating to a small vicinity of the TDT critical point
depicted in "scaling coordinates".
The gray tones from dark to light code a level of the Lyapunov exponent from
minus infinity to zero, and black corresponds to positive values of the Lyapunov exponent.
With passage to each the next picture, the horizontal and vertical coordinates
are rescaled by factors