 |
Arnold's cat map |
A two-dimensional map

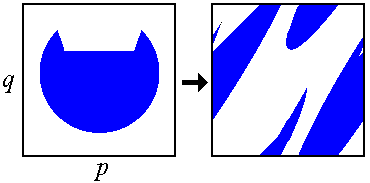
is known in literature as Arnold's cat map. (Prime marks the dynamical variables relating to the next step of discrete time.) State space of this system may be interpreted as a surface of torus, on which two phase variables determines latitude and longitude. (We suppose the both are defined in a unit interval.) For graphical illustrations it is more convenient to use a unit square assuming that the opposite sides of it are identified. The origin of the name goes back to V.I. Arnold who suggested this map as an example of chaotic system on torus and illustrated its action with the picture of cat face (see figure).


The Arnold cat map relates to the class of conservative systems: under the mapping any domain (say, a cat face) conserves the area. It is proven that this map manifests chaotic dynamics in a sense of the Anosov theory. Two Lyapunov exponents for the Arnold cat map are
![]()
Observe that the larger exponent is positive. Some additional information about the Arnold cat map and other toral mappings may be found in a section of our site devoted to quantum chaos.
It is worth noting that the Arnold cat map may be represented as a result of two-fold application of a simpler mapping:

Indeed,

Now let us turn to a problem of physical realization of the Arnold cat map. For this, we consider a system of four coupled non-autonomous van der Pol oscillators

Here x, y, z and w are coordinate variables for the oscillators, A is amplitude of modulation of the parameter controlling the Andronov - Hopf bifurcation in the oscillators, T is period of the modulation, which contains as assumed an integer number of periods of basic oscillations 2p/w0, e is coupling parameter.
The system operates as follows. Let the first and the second oscillator oscillate with phasesФx and Фy, respectively:
![]()
while the second pair of the oscillators is under the generation threshold. At the beginning of the excitation stage of the second pair, the third oscillator z undergoes effect of the priming signal represented by the product xy and containing resonance component with the doubled frequency:
![]()
Hence, the third oscillator accepts the phase Фz=Фx+Фy. The fourth oscillator w is excited simply by the signal x of frequency w0, and accepts its phase Фw=Фx. Next, as the generation stage for the second pair comes to the end, the signal w serves as priming for the oscillator y entering the excitation phase, and signal z due to mixing with auxiliary signal of frequency w0 gives rise to oscillations of x:
![]()
(the second term in the formula is resonance). As a result, on the new generation stage the first and the second oscillators accept phases, respectively, Ф'x=Фz=Фx+Фy and Ф'y=Фw=Фx. Accounting that the phases are determined up to an integer number of 2p and introducing the normalized variables q=Фx/2p and p=Фy/2p, we come to the map p'=q, q'=p+q (mod 1). Been applied twice, it gives rise as explained to the Arnold cat map.
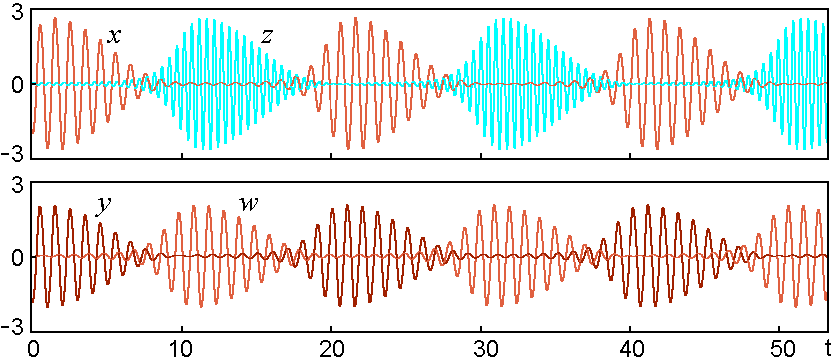
The next picture shows plots for variables x, y, z and w versus time in the system manifesting chaotic motion in accordance with the described mechanism. The plots represent results of the numerical solution of the equations at w0=2p, T=20, A=2, e=0.4.

Chaos reveals itself in a random walk of maxima and minima in respect to the envelope. To demonstrate correspondence of the dynamics of the phases to the Arnold cat map we apply the following procedure. In a course of numerical integration of the dynamical equations we determine phases of the first and the second oscillators in the middle of each excitation phase as

If the point (Фx, Фy) hits the area of the cat face we depict it on the diagram, and also depict the respective image positions (Фx Фy) on two subsequent plots, after the time intervals 2T and 4T. Accumulating a big number of points we observe the cat face and its images corresponding to one and two iterations of the Arnold map. The pictures may be compared with those obtained directly from iterations of the Arnold cat map. Accurate correspondence is reached if we add in both equations additional constants. They correspond to summand terms appearing in a course of transfer of excitations of oscillators to their partners. With these, empirically selected constants, the mapping is transformed to

Compare two below series of diagrams to see a remarkable correspondence of the phase dynamics in our model to that in the modified Arnold cat map.


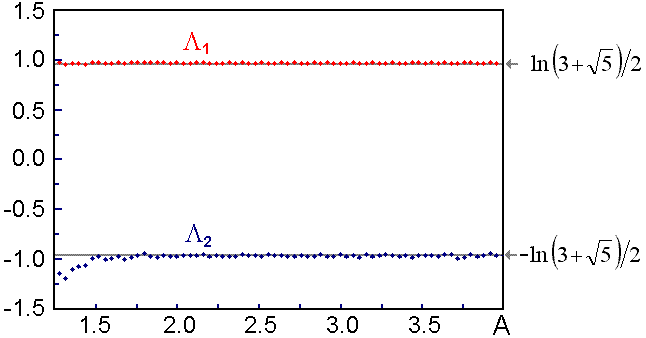
The last figure shows a plot of two larger Lyapunov exponents for the system of coupled non-autonomous van der Pol oscillators in dependence on the amplitude of slow modulation A at fixed other parameters. As a unit of time we take here the period 2T.

As observed, in a wide interval of the parameter both the Lyapunov exponents remain approximately constant in good accordance with the values expected for the Arnold cat map.
Remark.
Formally, complete description of the system under consideration
in terms of stroboscopic Poincare map requires 8D mapping. Indeed,
an instantaneous state of the system is determined by a set of eight variables