 |
Bernoulli map |
 Let us consider a one-dimensional map
xn+1={2xn}
where the braces designate a fractional part of the number. The plot of the map and the iteration diagram for several steps are shown in the picture.
It is convenient to represent the variable x in a binary notation, then the digit 0 at the first position after the dot corresponds to residence of the state of the model in the left part of the unit interval, and 1 to residence in the right part. Let us have, for example,
x0=0.01011010001010011001010...
One step of the evolution in discrete time consists in a shift of the whole sequence of the digits for one position to the left, with removal of the most left digit:
x1=0.1011010001010011001010...
x2=0.011010001010011001010...
and so on. Such a transformation of the binary sequence is called the Bernoulli shift.
With an initial state defined by a random digital sequence obtaiined, say, by throwing a coin with a rule of heads or tails: x0=0.0101101... Then, in a course of iterations the observed state will visit the left or the right half of the unit interval following exactly to the random sequence we have defined. Here it is, chaos!
It is clear that a small perturbation of initial condition with one step of the iterations grows twice. Hence, the Lyapunov exponent for this mapping equals ln 2=0.693.
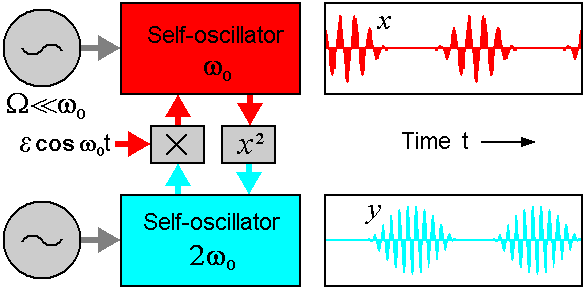
How can we arrange dynamics corresponding to the Bernoulli map in a physical system? Let us torn to a block scheme shown in the figure. It is a non-autonomous oscillatory system composed of two self-oscillators with characteristic frequences w0 and 2w0. The parameters controlling excitation of one and other oscillators are slowly modulated in counter-phase with period T, which equals to an integer number of periods of the basic frequence: T=2pN/w0. Thus, both oscillators generate alternately. The first oscillator effects the second one through a quadratic nonlinear element. The generated second harmonic serves as a priming for excitation of the second oscillator. In turn, the second oscillator acts on the first one via a term represented by a product of the dynamical variable and an auxiliary signal of frequency w0. Thus, a component with the difference frequency appears, which fits the resonance range for the first oscillator and serves as a primer as it starts to generate. Both the oscillators transfer the excitation each other, turn by turn.

To explain why the device operates as a chaos generator, let us assume that on a stage of generation the first oscillator has some phase j. The output signal of the coupling element contains the second harmonic, and its phase 2j is transferred to the second oscillator as it starts to generate. Due to a mixing with the auxiliary signal, the doubled phase is transmitted to the original frequency band. Thus, the excitation of the first oscillator at the next stage of its generation will occur with this phase 2j. On subsequent excitation stages of the first oscillator for the phase normalized by 2p, q=j/2p, the Bernoulli map will hold: qn+1={2qn}.
To observe the above mechanism in numerics, let us consider a system of two van der Pol oscillators with time-dependent parameters

The next figure shows variables x and y versus time in this system in the regime of chaotic motion with alternating exchange by excitation. The diagram is obtained from numerical solution of the equations at w0=2p, T=10, A=3, e=0.5.

The chaotic nature of the dynamics reveals itself in a random walk of humps on subsequent periods of swing in respect to the envelope of the generated signal. The next picture is an empirical diagram for a phase of the first oscillator determined at the middle parts of the excitation stages. In a course of the numerical solution of the equations we plot the points (qn, qn+1) for a sufficiently large number of periods T.

So, we have obtained the mapping of the same type as the Bernoulli map. Although it is somewhat distorted, it is not so essential. The main thing is that it relates to the same topological class as the map qn+1={2qn}: Indeed, we have two branches of the plot disposed exactly like in the first diagram in the top of this page. The correspondence becomes better with increase of the ratio of the periods N.
Remark. In more accurate formulation, the map determining evolution of the system of two van der Pol oscillators over a period T is four-dimensional. Geometrically, its action consists in expansion along the phase variable direction and strong contraction along other three dimensions. Due to this circumstance, the mapping in good approximation may be regarded as one-dimensional.
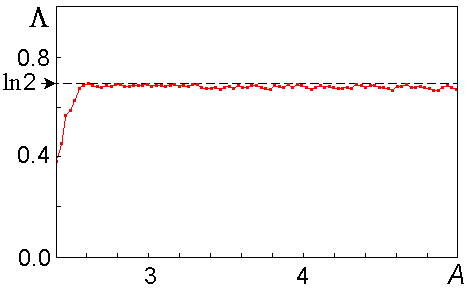
The last figure shows a plot of the largest Lyapunov exponent for the coupled non-autonomous van der Pol oscillators versus the amplitude of the slow parameter modulation A at fixed the rest parameters; as a unit time we take here the period T.

Observe that in a wide interval of the parameter the Lyapunov exponent remains approximately constant and equal to the value ln 2=0.693, which corresponds to the Bernoulli map. At small A the correspondence disappears: the Lyapunov exponent becomes notably smaller.